Comparative premise and scope
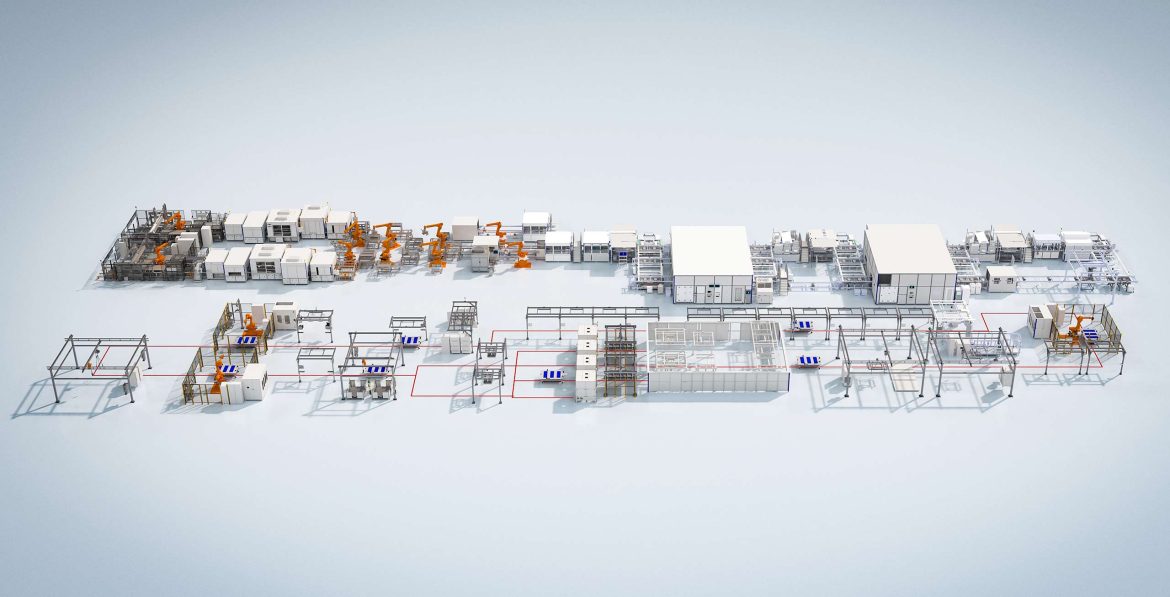
Comparative insight reveals where lifecycle value diverges from total cost and why those divergences matter to procurement and engineering decisions. Many manufacturers and battery pack assembly suppliers must weigh initial capital, integration effort, and long-term adaptability when selecting automation; similarly, integrators for battery pack manufacturing lines confront trade-offs between modularity and throughput. Observations reported at the Battery Show North America consistently show vendors framing benefits in either lifecycle-value terms (flexibility, upgrade paths, safety improvements) or in narrow total-cost-of-ownership metrics (capex, service contracts). This article uses comparative logic to disentangle those frames and to provide evaluative criteria suitable for engineering-led buying decisions.

Defining the comparison axes
Two distinct concepts require clear operational definitions before any comparison: lifecycle value and total cost. Lifecycle value denotes the aggregate functional benefits delivered over a system’s useful life: capability retention, process stability, operator safety, and upgrade potential. Total cost aggregates monetary outlays attributable to the system: acquisition, installation, retrofit, consumables, downtime, maintenance labor, and end-of-life disposal. Maintain both definitions throughout the assessment; collapsing them creates misleading conclusions.
Methodology for rigorous comparison
Apply a consistent, traceable method that produces comparable metrics across candidate technologies. Use these steps:- Identify boundary conditions: production volumes, product mix variability, environmental constraints (temperature, humidity), and safety standards.- Establish time horizon: choose a realistic useful life (for many automated cells, 5–10 years) and discounting policy.- Quantify performance metrics: throughput, yield improvement, mean time between failures (MTBF), and mean time to repair (MTTR).- Convert non-monetary benefits to monetary proxies when necessary: reduced warranty returns, fewer reworks, or reduced insurance premiums.- Create side-by-side scenarios: baseline (current manual or legacy automation) and alternatives (robotic cell, cobot-assisted line, vision-guided assembly).Record assumptions explicitly so decision-makers can update inputs as conditions change.
Technology profiles and comparative tendencies
Different automation classes display predictable patterns when placed on the lifecycle-value versus total-cost axes:- Fixed industrial robots: high capex, low per-unit marginal cost at volume; long lifecycle value when product designs are stable.- Collaborative robots (cobots): lower initial cost and faster deployment; lifecycle value depends on ease of redeployment and safety-envelope revalidation.- Vision systems and machine learning inspection: moderate capex, high lifecycle value where quality demands evolve; require ongoing data and model maintenance.- AGVs/AMRs: capex varies; they deliver network value as layouts change but can incur integration costs for fleet management.- Custom end-of-arm tooling and fixtures: low amortized cost if used continuously; high obsolescence risk when product designs shift.Compare these profiles using the same performance and cost metrics to expose where a higher initial price buys durable functional value or where recurring costs erode early savings.
Common pitfalls and mis-measurements
Evaluators frequently commit predictable errors. Avoid these:- Ignoring retrofit complexity: physical integration and PLC/IT harmonization often exceed budgeted hours.- Omitting downtime costs from trials: pilot phases may temporarily reduce productivity; capture those losses.- Overvaluing vendor-stated MTBF without field validation: vendor data often derive from ideal conditions.- Treating software updates as free: validation, regression testing, and operator retraining carry real costs.- Failing to model product-mix volatility: a solution that is optimal for a single SKU can be prohibitively costly across a varied portfolio.Document failures and near-miss experiences to refine future comparisons; prior project records are more reliable than vendor claims.

Comparative scoring template (practical application)
Construct a simple scoring template to compare candidates objectively. Weight categories according to organizational priorities and fill with quantified inputs:- Acquisition and installation cost (weight 30%) — include controls, conveyors, and safety guarding.- Operating cost (weight 25%) — energy, consumables, inspection, and routine maintenance.- Performance impact (weight 20%) — yield gains, cycle-time reductions, scrap reduction.- Flexibility and upgradeability (weight 15%) — modularity, ability to repurpose, software openness.- Risk and compliance (weight 10%) — safety certification, electromagnetic compatibility, hazardous-material handling.Multiply scores by weights and compare total scores alongside net-present-value projections. Use sensitivity analysis to show which assumptions change the preferred option.
Case-oriented comparative observations for battery pack lines
Apply the framework to battery pack assembly contexts with attention to electrochemical and safety constraints. Typical considerations:- Cell handling and thermal management require tooling that reduces mechanical shock; lifecycle value includes fewer cell failures and lower warranty claims.- Vision and torque-monitoring systems reduce connector damage; they deliver high lifecycle value where yield penalties are severe.- Integration of ventilation and fire-suppression interfaces adds upfront cost but materially reduces insurance and regulatory exposure.These observations reflect practices commonly discussed among integrators and OEMs at major industry gatherings and in field installations.
Decision guidance and procurement language
Translate comparison output into procurement terms to avoid negotiation deadlocks. Specify acceptance metrics tied to lifecycle benefits: minimum acceptable yield uplift, permissible MTTR, and validated redeployment time for cells. Require vendors to provide field references with comparable environmental and regulatory constraints. Include clauses for staged payments tied to performance milestones rather than simple delivery milestones. Insist on complete interface documentation and a defined handover that includes training, spare-part lists, and test scripts.
Synthesis and concluding comparative judgment
Comparative analysis shows that higher upfront expenditure can be justified when the automation’s functional benefits persist across the chosen horizon and when recurring costs are predictable and controllable. Conversely, low-capex alternatives rarely compensate for structural inflexibility when product or regulatory change is probable. For practitioners seeking a reliable balance of lifecycle value and manageable total cost, field-proven integration practices and transparent, scenario-based scoring mitigate procurement risk and clarify trade-offs; institutionalizing those practices draws directly on long-term installations and integrator experience, yielding choices that align operational priorities with sustainable capital deployment as practiced by FHS.