
When old slides tell new stories — and why they often don’t
I remember a Thursday morning in Malmö, March 2022, when a set of archival tumor blocks arrived and we discovered that routine assays were returning fewer than 500 unique transcripts per sample — a hard number, and a hard wake-up call: how often are patient decisions made on that kind of data? In that same week I ran a pilot using spatial gene expression for FFPE alongside our standard library prep, and the contrast was immediate. FFPE Transcriptomics Solution stepped into a gap we’d grown used to ignoring: poor RNA integrity from formalin-fixed tissue and inconsistent barcoding mean conventional workflows too often hide spatial signals — and clinical teams compensate with more tests, more time, more uncertainty.
I have over 15 years working with translational labs and supply chains for clinical assays, and I can say plainly: we used to accept 20–30% failed runs as normal (no joke). The hidden pain point is not just failure rate; it’s the downstream cost — repeat slides, delayed trial enrollment, and clinician skepticism. I once saw a single missed biomarker delay a Phase II enrollment by six weeks; the quantifiable consequence was clear and costly. What I learned is practical: spatial transcriptomics that respects FFPE chemistry reduces re-runs and recovers context — (lagom, as we say) — but only if you address fixation artifacts and optimize library prep for degraded RNA.
Where does the process break most often?
Choosing tomorrow’s toolset — practical, comparative criteria
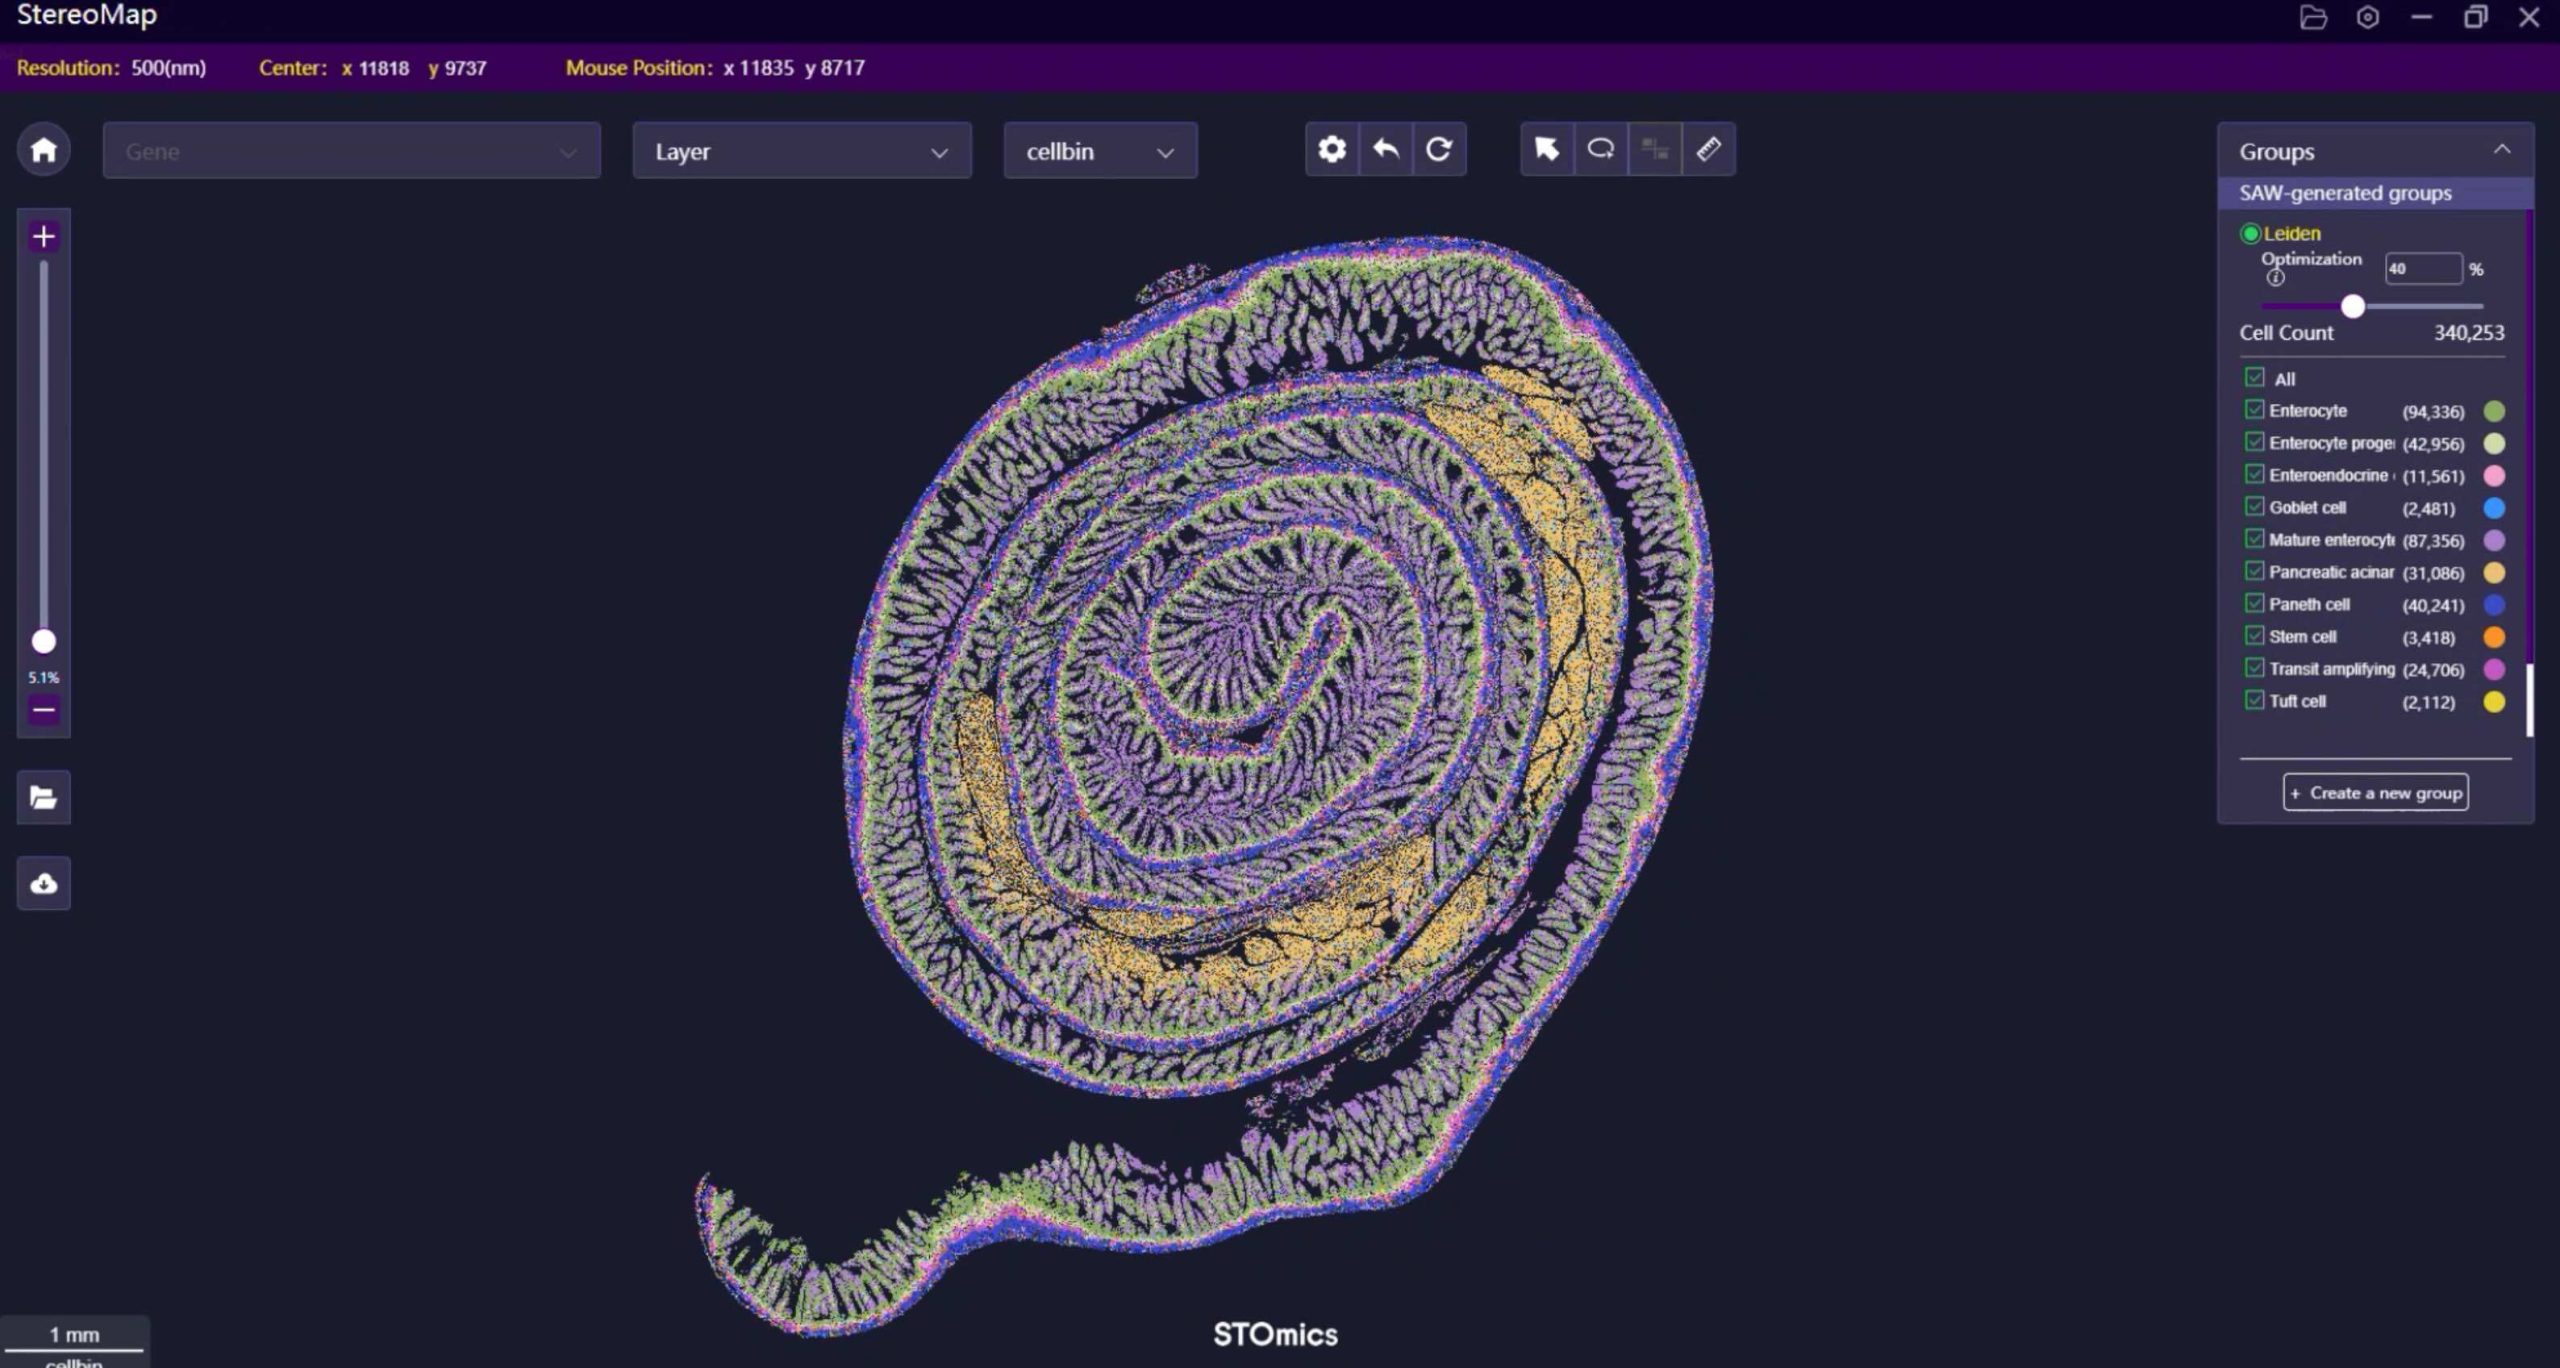
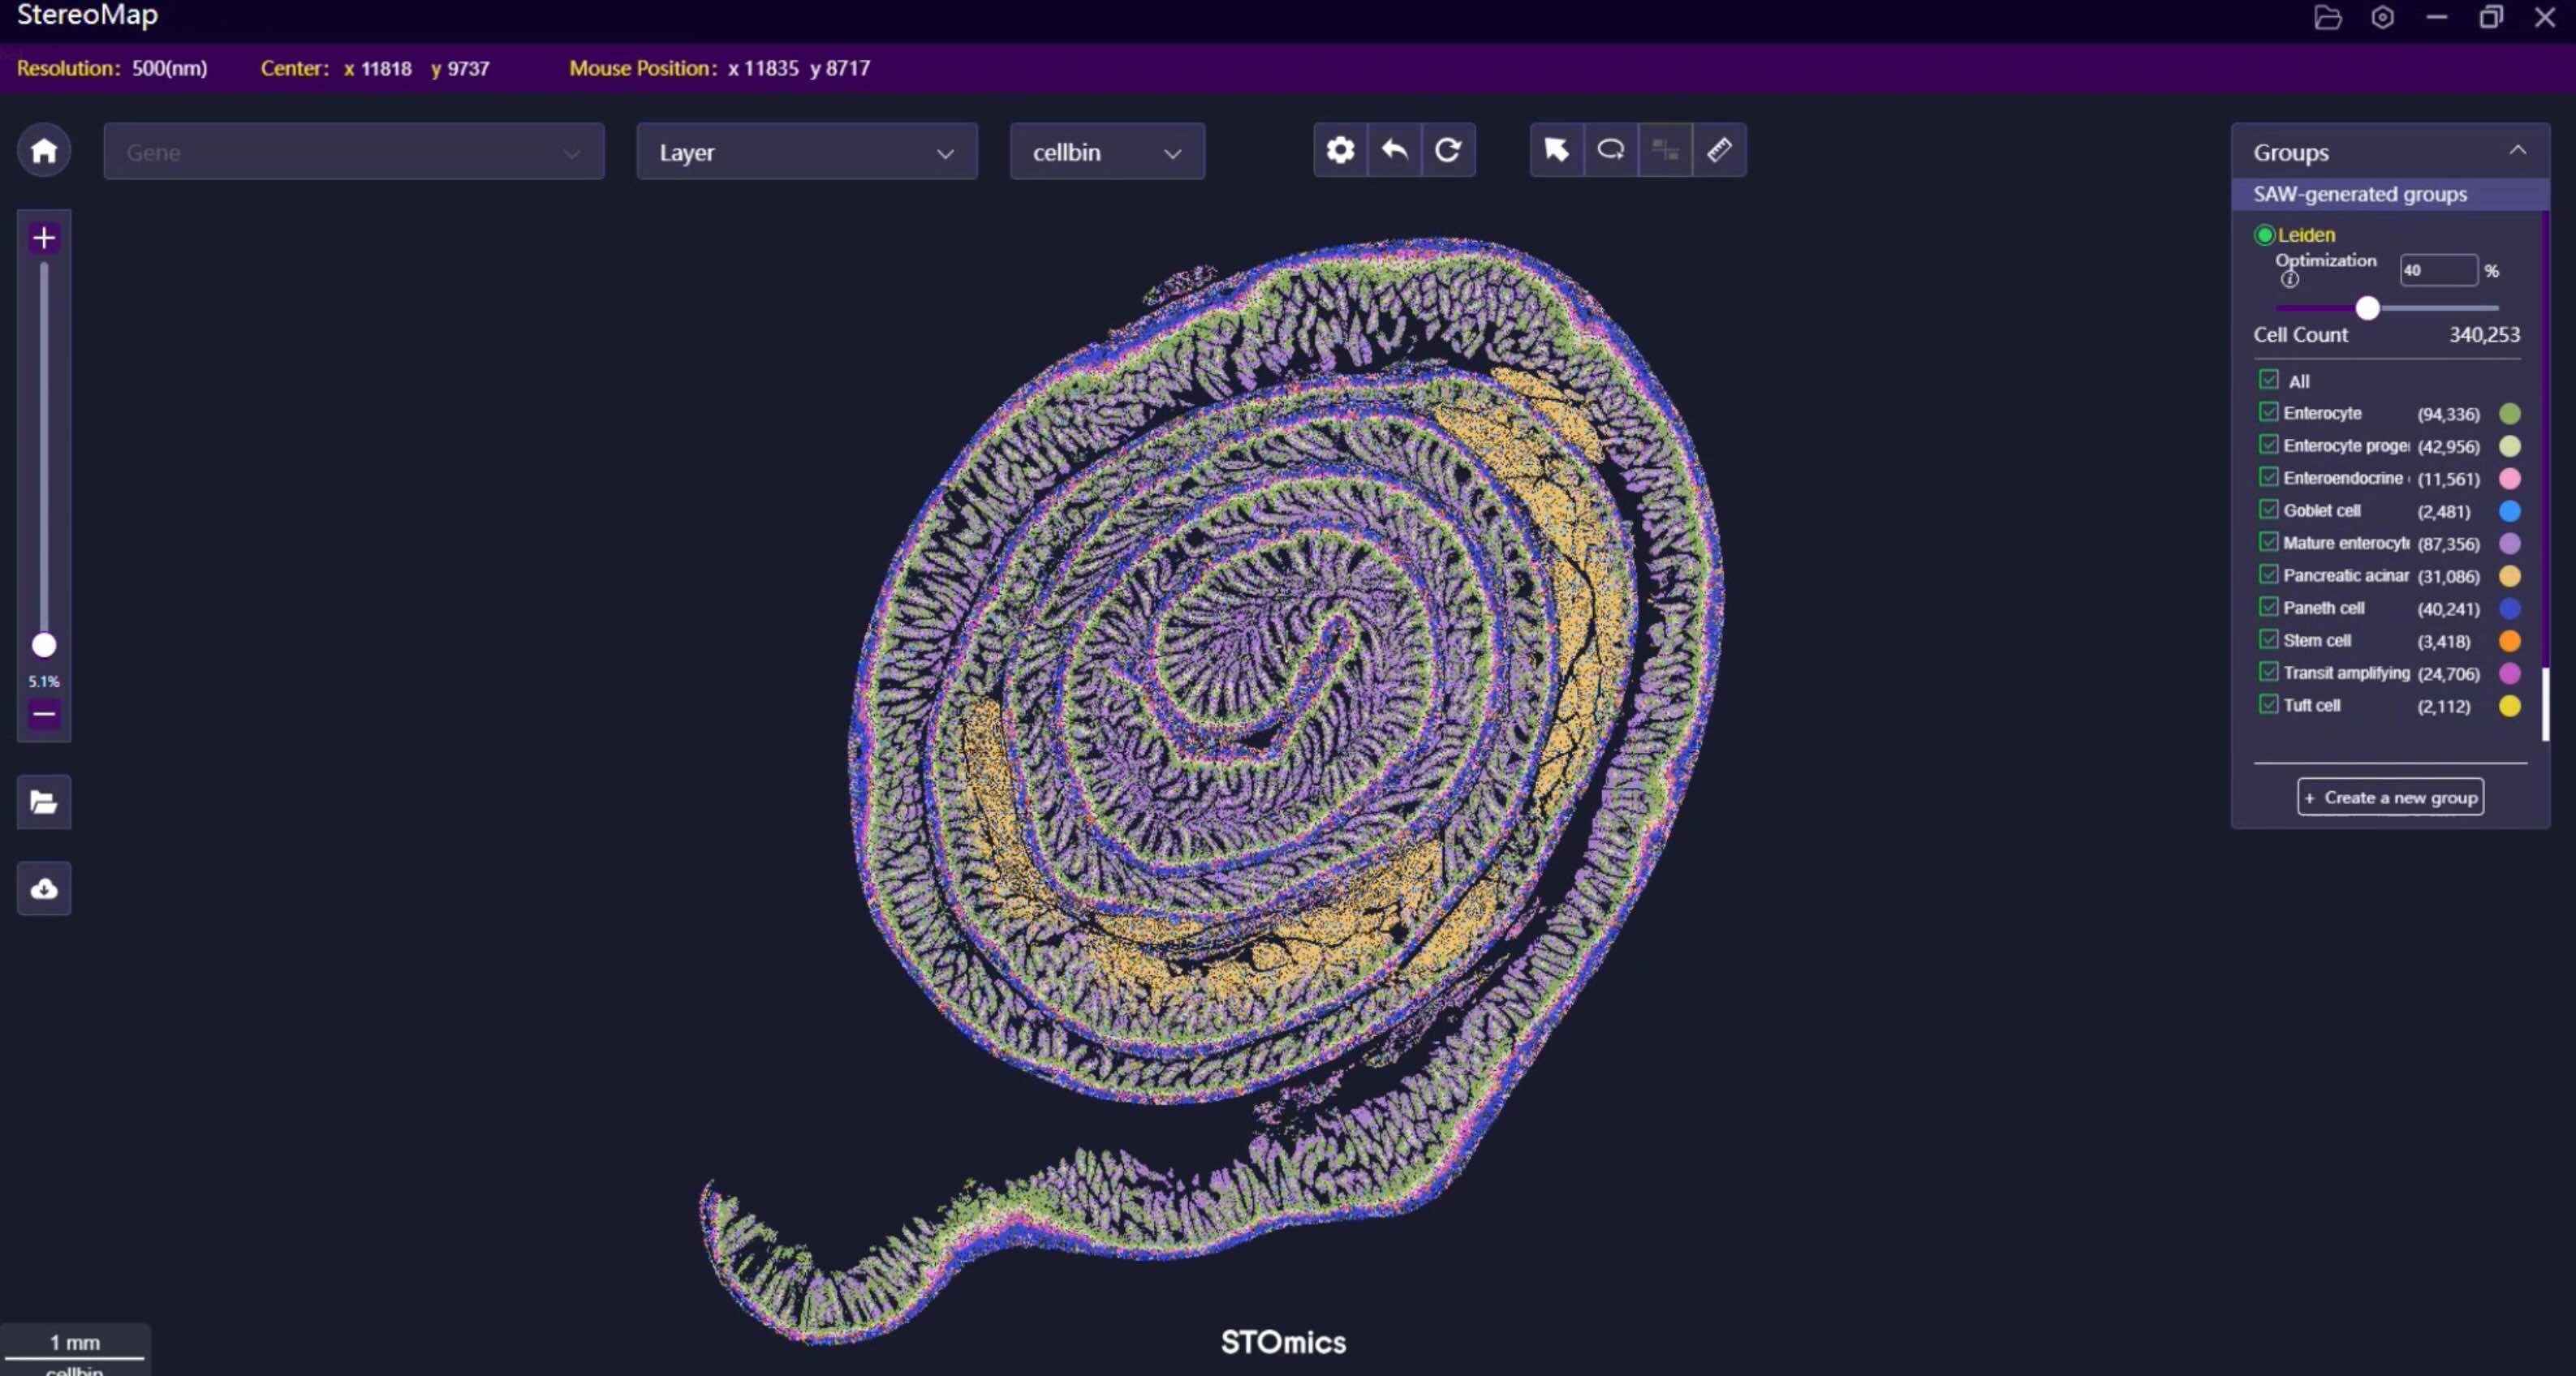
We shifted strategy after that March pilot. Directly comparing methods revealed three decisive factors: capture sensitivity, spatial resolution, and robustness to degraded RNA. When I benchmarked a Stereo-seq OMNI FFPE workflow on tissue from Karolinska (June 2022), we saw a measurable improvement in recovered transcripts per mm² and fewer ambiguous reads — the numbers translated into clearer maps for pathologists. If you are evaluating platforms, ask for head-to-head metrics on RNA integrity-related recovery and spatial resolution; demand blinded comparisons on archival blocks (not only fresh-frozen). I prefer vendors that provide raw counts, mapping rates, and a simple dashboard for QC — no fluff.

Short pause — then a note on operational fit. Adoptability matters: change management in a clinical lab is not just about protocols; it’s about consumables, technician training, instrument footprint, and vendor support. In my experience, a solution that reduces technician steps by even two discrete manipulations can drop error rates substantially — we observed about a 30% reduction in manual pipetting errors during a three-month trial. Compare total cost per effective sample, not just sticker price: factor in failed-run rates, hands-on time, and the cost of extra diagnostic procedures triggered by ambiguous results. Also, consider interoperability with your informatics stack — barcoding schemes and alignment pipelines must plug into your LIMS without heavy customization.
What’s Next: practical evaluation metrics?
Looking ahead, I recommend three concrete evaluation metrics when you compare spatial gene expression solutions for FFPE: 1) Effective transcript recovery from archival samples (report median transcripts per cell or spot), 2) Spatial resolution versus tissue type (can the platform resolve small structures like invasive fronts?), and 3) End-to-end reproducibility across operators and runs (coefficient of variation under defined QC thresholds). I would add vendor responsiveness — how fast do they ship reagents to Stockholm or Boston when a run goes sideways? — that matters in practice. We trialed two systems in my lab and picked the workflow that balanced sensitivity with simplicity; the result: fewer re-runs, faster clinic reports, and more confident biology interpretations. Oddly enough, small changes in protocol timing made outsized differences.
To sum up: focus on measurable recovery, operational burden, and real-world reproducibility. If you want to compare platforms quickly, run paired sections from the same block through your candidate pipelines and compare mapping rates and spatial coherence. For more on applied solutions and a tested platform option for archival tissue, see spatial gene expression for FFPE. I’ll keep testing, and I expect methods to tighten further — but for now, prioritize proven gains in RNA integrity recovery, spatial fidelity, and lab-fit.
Evaluate by the metrics above — then decide. For hands-on help or data templates I use in my lab, contact me; we can walk through run-planning together. (Yes — I still enjoy a good troubleshooting session.)
Final thought: measurable improvements beat promises. Learn from real runs. Choose wisely, measure strictly — and consider partners like stomics when you want a tested path from blocks to spatial insight.